CLIENT
The largest deposit institution in Scandinavia
CHALLENGE
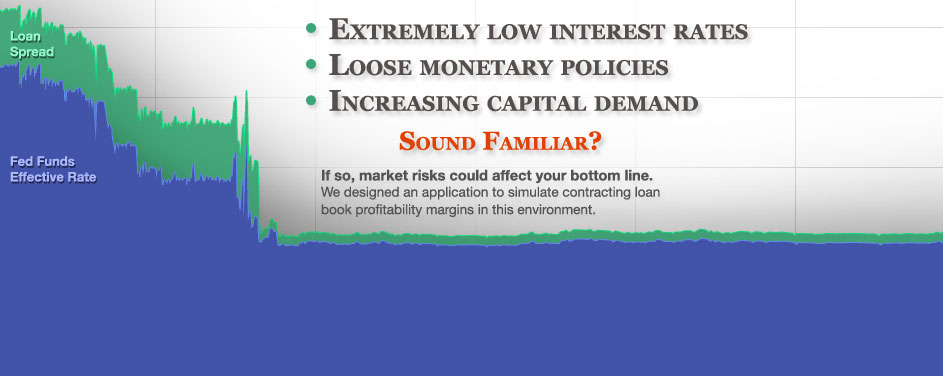
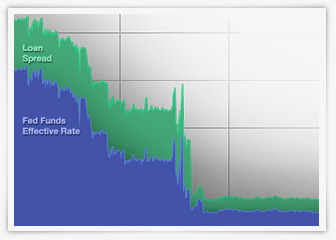
Our challenge lay in modeling the economic market risk of contracting spreads on administered rate loan products in low interest rate environments: the effect of deposit interest rates near or at 0%, with loan interest rates steadily declining, compressing net interest margin and profitability. Our client endeavored to allocate market risk economic capital to cover lost profitability, represented by this contracting net interest margin.
It is in these low interest rate environments that demand for capital is often highest, making market risk a key factor in managing aggregate credit extension, product pricing, and fees.
IDEAS
eBIS analyzed the business requirements and internal processes of the client’s market risk group, and recommended a solution model that was parameter-driven, flexible, scalable, and integrated with a larger initiative to build a data warehouse for all capital and profitability reporting. We categorized various functional requirements, analyzed alternatives, and then submitted our ideas, creating the foundation for a robust technical solution.
We categorized our ideas into 5 areas for ease of reference and management:
1) ARCHITECTURE
- Translate existing spreadsheet analysis to a scalable relational database environment with a flexible development platform, enabling user-defined input parameters on the front-end and the ability to reactively change modeling architecture on the back end.
- Minimize data redundancy and maintenance by centralizing configuration, input and output data in a central data warehouse, common to all economic capital engines. Benefits:
a) A common data model
b) Consistent processing architecture
c) Reliable data inputs, which are validated and cleansed prior to processing
d) Modeled dimensions that provide depth and meaning to fact data
e) Scenario capabilities, allowing comparison of varying business assumptions
2) STOCHASTIC INTEREST RATE SIMULATION
- Using prevailing interest rate levels as a starting point, stochastically simulate interest paths through time using the Cox, Ingersoll, Ross monte carlo method. Calibrate a trend line relative to the interest rate starting point.
- Simulate interest rates to a user-defined horizon, e.g., 10 years, with income losses discounted on an NPV basis back to the end of year 1 using a user-defined discount factor, or one inferred from the stochastic equation.
- Set the number of interest path iterations based on user input. Enable scalability of simulation paths to the hundreds of thousands.
- Set stochastic generation for capital allocation to 50,000 paths, a level that allows modeling at a high downside confidence interval, 99.97%, representative of a desired S&P credit rating of AA.
- Provide a random seed input to control reproduction of simulations across models and within variables, e.g., currency.
- Allow definition of a simulation index separate from product pricing indicies. A delta in the simulation index would apply to the forecast periods of a product pricing index.
- Truncate simulated price movements at 0, but track internally the cumulative price level when negative. In instances where the simulation index has a starting point higher than the product pricing index, the deltas could trend to positive territory later in the simulation.
- Make the simulation index currency specific, associated to either the transaction or base currency.
3) RELATIVE INTEREST RATES & VOLATILITY
- Tie the magnitude of volatility to relative interest rates; high interest rate environments will produce larger simulated interest rate movements than low ones. Use a volatility algorithm that prevents simulated interest rates from dropping below 0.
- In stochastic modeling, force the interest rate path back to an assumed long-term rate based on two user-defined variables: a) mean reversion speed and b) term of volatility.
- Provide the ability to model an expected path of interest rates, modeled without the volatility component, for expected loss calculations.
- Start the simulation at any point (maturity) on a user-specified historical yield curve, allowing for currency-specific simulations.
- Assume parallel shifts in the asset and liability rates. If empirical evidence suggests interest rates shift non-congruently by product, provide the ability to adjust the indices representing the asset and liability sides of the spread equation discretely.
- Calibrate model parameters to account for lower volatility at low interest rate levels, yet theoretically greater risk of loss events (contracting margin), and hence higher economic capital.
4) CAPITAL CALCULATION
- Employ VaR as the analytic measure, with downside loss levels measured as the difference in net interest margins through time, translating directly to allocated capital levels through a loss function.
- Make the loss function calculation dependent on the simulation index interest rate starting point and its position relative to the assumed long-term interest rate. If the starting rate is < the long term rate, the unexpected loss is the path of rate simulation below the starting rate. If the starting rate > the long term rate, the unexpected loss is the spreads between the expected long term rates and unexpected rates.
- Focus the loss function on simulated interest income and expense cash flows, which are not easily hedged centrally through transfer pricing. Exclude from analysis fee or non-interest income that may be administered as a reaction to interest rate levels.
- Make capital allocation a function of the loss distribution, specifically the loss at the desired confidence interval in a tailed test, given the user-specified number of iterations. In a simulation of 50,000 interest rate paths in a one-tailed test, capital is allocated against the 15th largest portfolio income loss.
- Adjust portfolio loss for VaR correlation and diversification factors to arrive at a final capital number.
5) DIMENSIONAL MODELING
- Use product groups to pool positions with similar attributes for processing and analysis. Use a weighted average formula for calculation of variables that differ within product group.
- Allow for scenario-based simulation parameters to override standard product attributes. For instance, if an administrative rate product pricing schedule calls for repricing upon a change in the fed funds rate, during simulation change the reprice trigger to any change in the stochastic rate path.
- Multi-dimensionalize the lost margin spread according to the input grain: currency, product group and department.
SOLUTION
We delivered a detailed architectural model for estimation of extreme downside interest rate market risk, calibrated to allocate capital relative to expected interest rates, and integrated with an enterprise risk management software suite.
Through tight collaboration with client stakeholders and an enterprise software vendor, we generated value-added ideas, and then applied them to an application roadmap. It was through our bridge-building process that our client received critical business solution architecture on an enterprise risk management platform where none previously existed.
A win for our client through improved functional modeling, solution flexibility, and data integration. A potential new product offering for an enterprise vendor partner. And eBIS helping in between doing what we do best: facilitating solutions for our clients.
RESULTS
In times of activist monetary policies, instituted by central banks to increase economic activity, commercial and retail banks feel pressure to increase capital supply. In these environments, interest rate market risk assumes heightened significance. Deposit interest rates can approach zero. Customers clamor to secure capital. Net interest margin compression can materially affect bank profitability. Case in point: JP Morgan Chase saw its net interest margin fall 31 basis points from March 31 to September 30, 2010, decreasing its net interest income by $1.2 billion. Financial institutions need a tool to assess the risk of market variables derailing their revenue model, influencing tangential areas such as product pricing, fees and credit extension.
eBIS provided this mechanism, enabling our client to understand the potential effect of market interest rate variables on product profitability. The result? Much more informed loan book management.