Modeling Derivatives

CLIENT

Manager of one of the world’s 10 largest derivatives portfolios

CHALLENGE

Derivatives have emerged as a prominent financial tool, employed by both financial and non-financial businesses to hedge risks, and some insurers, banks, and investment managers to increase risk.  The latter often takes the form of proprietary trading, where derivatives can magnify returns through leverage, enabling sometimes extreme counterparty and asset class risk concentrations.  In 2003, Warren Buffett predicted that derivatives would act as a “financial weapon of mass destruction.”  Investment in derivatives grew considerably after that warning and in 2010 total notional value in outstanding derivatives contracts exceeded $600 trillion, almost 5 times the total value of the world’s stock and debt markets.  To help mitigate latent downside risk, firms trading or making markets in derivatives, whether defensively as a hedge or speculatively for profit, need to closely track and actively manage the counterparty risk in their over-the-counter positions.

Our client, a large participant in FX markets, and holding risky derivatives across markets and trade types, needed a solution to comprehensively capture credit-related data on derivatives exposures across their enterprise.  They turned to eBIS to analyze their book of derivatives business, captured on a multitude of tracking systems, and devise a solution for risk modeling, quantification, and reporting.  The solution needed to address the following requirements:

Data Consolidation

  • Consolidate trade-level data from multiple source systems into a consistent data model.
  • Accommodate modeling of, and create reporting taxonomy for, all trade types and markets:
Trade Type Market
Spot Credit
Forward Equity
Future Currency
Option Interest Rate
Swap Commodity
Exotic

Credit Limit Monitoring

  • Associate credit facility limit and usage calculations to individual trades.

Accounting

  • Report fair value and hedge accounting as required by FASB statement 133.
  • Accommodate counterparty deal accounting for structured positions.  Report dominant trade notional, net exposure, and dimensionality.
  • Accurately report position information to the general ledger.  Some derivatives product systems lack a mechanism to accurately post a marked-to-market and notional balance.

Exposure Quantification

  • Facilitate capture of credit risk mitigants (netting, collateral), offset permissions and their associations to exposures.
  • Report positive marks after netting and potential future exposure calculations for internal analysis of downside credit risk and profit contribution.
  • Provide trade-level details for calculation of a Basel II-compliant current exposure value.

Trade Management

  • Provide a method to effectively eliminate reporting of trades between internal desks.
  • Identify hedge trades and the portfolio exposures being hedged.
  • Capture all derivatives data, identifying OTC positions separate and distinct from those trades executed on, and guaranteed by, exchanges.

IDEAS

We analyzed each requirement and formulated design ideas to address each need.

Data Consolidation

  • Create a single, custom-built data store for integration of all product systems.
  • Use 3 trade attributes: family, type, and sub-type to drive selection criteria for reporting and analysis of other data elements

 Credit Limit Monitoring

  • Use facility identifier on trades to enable calculation of usage and remaining available credit

Accounting

  • Initiate a back office accounting project to calculate FAS 133 fair value for requisite trade types, including cash flow and foreign currency hedges.
  • Establish a back office process to properly identify a dominant trade notional within a structured deal and consolidate its mark-to-market accounting.  Deliver dimensional information, including product, with accounting balances to categorize the position.
  • Initiate a back office reengineering project, centering on a product system upgrade, to improve the GL posting process for revalued OTC mark-to-market calculations and FX trade notional values.

Exposure Quantification

  • Create a mitigation data model to capture rules for netting trades and assigning collateral to netting agreements.
  • Calculate a positive marks after netting balance and potential future exposure value per counterparty credit facility for internal credit reporting.
  • Use trade-level attributes for Basel II current exposure method calculation, leveraging mitigation relationships and notional and MTM balances assigned to trades.

Trade Management

  • Use trade-level attributes of customer and department to determine if a given trade originated between desks within the same business unit.  If so, exclude it from credit analysis.
  • Instruct traders to flag trades for hedge accounting.  Use a reference customer, facility or bond ticker to identify the exposures being hedged.
  • Comprehensively consolidate derivatives trades for FFIEC reporting, and use the customer and facility identifiers to segregate those positions traded over-the-counter and thus relevant for counterparty risk analysis.

SOLUTION

eBIS delivered the derivatives analysis solution that our client required.  It provided a centralized derivatives model and reporting platform, incorporating requirements across all stakeholders: trading desks, the derivatives back office, credit portfolio management, regulatory reporting, finance quality assurance, and management accounting.  We carefully analyzed reporting needs, developed ideas, and then delivered a derivatives monitoring and reporting solution embraced by all of these internal clients at the bank for the first time.

Of particular note, the solution enabled:

  1. Accurate counterparty credit risk monitoring, including concentration risk analysis
  2. Comprehensive FFIEC reporting of all derivatives positions
  3. Calculation of economic credit capital
  4. Calculation of Basel II regulatory capital through the Current Exposure Method
  5. Quantitative Impact Study (QIS) scenario analysis
  6. Capital relief through identification of swap hedge positions

RESULTS

Derivatives were cast as a central character in the Global Credit Crisis. AIG issued credit derivatives in excess of $2 trillion, requiring a taxpayer bailout. Merrill Lynch created off balance sheet SIVs for selling CDOs that it then guaranteed with total return swaps, eventually leading to its forced merger. At the time of its collapse, Lehman Brothers had derivatives contracts in place with over 8,000 counterparties, many of whom were not fully repaid pledged collateral or compensated for a positive marks position. As the crisis spread, it became clear that some firms were not monitoring and managing the counterparty risk in their derivatives exposures effectively.

Post-crisis, financial firms continue to deal extensively in derivatives, with JP Morgan, the U.S.’s largest dealer, holding contracts worth over $75 trillion in notional value on 30 June 2010.

In this context, eBIS helped our client understand crucial components of their derivatives risks through the credit crisis and beyond. The net effect? For our client, the financial weapon of mass destruction appears much more manageable.

Capital Savings In Securities Lending

CLIENT

A top 3 US custodian bank

CHALLENGE

Short sale coverage and the need for low-cost avenues to increase securities inventory for many broker-dealers has created a robust market for securities lending. Custodians with large portfolios of securities often indemnify their customers from loss and earn a split fee for lending those securities to other financial institutions, a low risk and high margin business. However, indemnified securities lending creates extremely large due from balances in the banking book, representing the risk of financial counterparties failing to return the borrowed assets. In practice, pledged collateral normally eclipses the value of securities lent and is re-margined daily, greatly reducing or negating the tangible exposure to the custodian.

A challenge lies in quantifying the economic reality of this risk in a manner that considers the potential down-side price movements of both sides of the transaction: the security lent and the collateral received. Moreover, one must implement the calculation such that it reflects the true risks of this business for internal capital modeling: the ability to quickly liquidate collateral and replace securities lent in liquid markets.

The Federal Reserve issued a guidance letter under the Basel I capital rules permitting capital relief for certain securities lending portfolios: double indemnified transactions (re-hypothecation), and those secured by non-cash collateral. Capital could be reduced to a net exposure (securities lent – collateral received) plus Value at Risk (VaR), accurate to 99% confidence, using a market risk methodology to approximate an equivalent unsecured loan balance. The VaR must represent a stressed 5-day simulation of downside price movements against both the short and long positions by security type. Although reported quarterly, the calculation must execute daily for all reportable portfolios and prove reliable to a 97% confidence interval. Without adherence to this guidance letter, custodians are relegated to regulatory capital at 1.8% of aggregate gross nominal balance, punitive and potentially prohibitive for business line viability.

Any solution must also adapt to changing requirements for subsequent capital regimes (Basel II, etc.). Specifically, Basel II permits VaR treatment for a much broader range of repo-style portfolios, significantly expanding the opportunity for capital relief. In addition, it specifies criteria for collateral eligibility, including exclusion of sub investment grade and unrated debt, not present under Basel I.

On the technical side, we faced client-specific challenges from internal systems, which affected the ability to meet the Fed’s reliability benchmark. Some upstream systems compiled data manually, without systematic logic and validity checks, and many failed to meet service level agreements for timeliness of data delivery.

IDEAS

We developed ideas in three areas to help our client address the complex challenges of risk analysis and capital computation in securities lending:

Data Environment

Build a database environment that can model all data from the bank’s securities lending businesses, and use it to create portfolios of securities defined by counterparty collateral agreements. Model these agreements discretely within this data framework for ease of validation.

Run stressed VaR calculations, using historical securities prices as model factors, against both the securities lent and collateral components of the portfolio, and model risk based on the residual exposure plus VaR, as permitted under the Federal Reserve guidance letter.  Use the central environment for data capture and definition to coordinate all calculations.

Reliability

To address the requirement of 97% reliability, and combat source system issues with data quality and timeliness, build a parallel processing architecture that allows for re-processing of dirty data or delinquent extracts delivered outside of a normal processing window.  Allow the iterative data to flow through normal processing, delineated by a time dimension, facilitating analysis of sequential improvement in data quality and adherence to service level agreements.  The most recent time stamp would alert users to the cleanest, most comprehensive data iteration.

Adaptability

Leverage the architecture established for the subset of securities lending portfolios calculated under Basel I, and expand it to include all of the repo-style portfolios eligible under Basel II.  Tag each portfolio as applicable to a specific capital regime: Basel I, Basel II, economic capital, etc.

Include stream-based processing during the portfolio creation process.  For instance, if the data is intended for Basel II reporting, include a filter to exclude non-compliant collateral.  If relevant for Basel I, exclude the filter, potentially allowing the same set of data to be treated differently according to the intended reporting audience, easing data classification and ensuring accurate VaR calculations.

SOLUTION

The solution that we helped engineer created a central repository of securities lending data across lines of business and source systems, enabling comprehensive downstream processing.  Out of this environment grew:

  1. A process to catalogue the details of counterparty collateral agreements.
  2. A process to construct portfolios of exposure and collateral based on these agreements.
  3. A stressed VaR calculation over a five day window of both exposure and collateral components, meeting the regulatory requirements for capital reduction.

In addition, we were instrumental in delivering a solution to comply with data reliability requirements.  When unreliable source data became a critical inhibitor, eBIS stepped forward to address the problem with a proposal for an alternative processing path.  We translated our ideas into a robust architecture for data re-processing that satisfied the regulatory reliability benchmarks.   And we did so within a compressed timeframe, juggling resources and other project initiatives to ensure successful solution delivery.

RESULTS

Over $1 billion in regulatory capital savings. Regulatory capital reduction under Basel I from $1.41 billion to $6.8 million upon disclosure of VaR results in September 2007, with similar results ongoing. The liberated capital is available to the custodian for stock buy-backs, retirement of debt, and acquisitions, all of which contribute to shareholder value.

The solution provides a sensible, risk-sensitive capital calculation and reporting vehicle for an otherwise low risk, profitable line of business.

A Credit Risk Data Warehouse

CLIENT

A Top 10 (by assets) internationally active US bank

CHALLENGE

With advances in portfolio risk and profitability modeling, and the need for consolidated regulatory reporting, large financial institutions have increasingly turned to enterprise data warehouses to satisfy their requirements for data analysis and reporting.  Data warehouses provide numerous benefits in these scenarios: conformance of multiple sources of data, consistency in data modeling, and data transformation and calculation algorithms that provide data for analytic consumption.  In short, a “single source of the truth” no matter the reporting view or end user.

Our client faced the challenge of a diversified business model, with risk-producing lines of business in retail, commercial credit, global markets, securities processing, custody, asset management, and treasury management, yet no consolidated data environment in which to analyze their risks and report their positions.  They collected credit data from a subset of systems and supplemented with manual data feeds, introducing data quality problems.  They had never undertaken an initiative to comprehensively identify all of their risk and financial reporting data. With Basel II compliance looming on the horizon and divergent internal architectures for economic capital and profitability reporting, they acknowledged the value of data consolidation, and engaged eBIS to help engineer a solution.

It was clear the bank needed to upgrade its data collection and management architecture.  Our engineering challenges were many:

  1. Design a conformed dimensional data model to integrate over 45 source product systems, representing the 7 lines of business producing risk for the bank
  2. Determine the requisite data points to satisfy regulatory, corporate finance, and portfolio risk management reporting
  3. Reconcile source product system data to the general ledger, such that reportable data at a granular level reflects the bank’s official books and records
  4. Design an approach to identify and exclude transactions between closely held entities
  5. Accommodate the effects of merger and acquisition activity seamlessly
  6. Create a solution for retail modeling, pooling similar product exposures and assigning calculated credit attributes
  7. Devise a modeling approach for the Basel II concept of repo-style portfolios: pools of exposures that are collateralized and re-margined on a daily basis
  8. Create a consistent definition of credit exposure across the enterprise to feed both regulatory and economic capital calculations
  9. Integrate with external systems to calculate: a) value at risk for portfolios margined daily; b) a probability of default (PD) for every commercial customer; c) a loss given default (LGD) for each credit facility; d) economic credit risk capital and e) loan reserve
  10. Devise a process scheduling approach to manage technical execution across technologies and platforms
  11. Establish expectations with providing data systems and enable a process to identify and remediate source system data errors

Notwithstanding the immediate modeling challenges, our underlying objective was to create a scalable environment comprehensive of reportable risk and profitability data points from all lines of business, with the flexibility to absorb changing analytic requirements through time.  If banking regulations evolve or new portfolio modeling techniques emerge, our client would have the tool to not just adapt, but react quickly: an intelligently crafted enterprise data warehouse.

IDEAS

The bank had an existing profitability environment, with data input limited to two product systems, that provided a flexible development platform and established back end infrastructure.  With an eye toward the long-term benefits of integrating risk and profitability data, and potentially creating an enterprise warehouse environment that could eventually serve all data consumers, we supported the idea of leveraging the profitability environment for their initiative.

In contemplating design for such a large construction effort, we concentrated on developing ideas around each of the initiative’s architectural challenges.

  1. Data Model: Identify the complete list of exposure types, such as letters of credit and derivatives, and, where possible, construct a single data entity per exposure type, modeling discrete data attributes.  Conform data from multiple sources into each data entity, creating a consistent functional representation.  Capture data at the lowest possible grain, facilitating detailed analysis where necessary with the potential for aggregations and summary reporting. Create a robust dimensional model that includes the dimensions of time, customer, department, organization unit, asset category and product. Design a multivariate time dimension for measures that would allow for analysis of three factors: the date of valuation, the date of data extraction in source, and the date of data processing in our warehouse.   Of particular importance for our primary audience of credit risk and portfolio managers were the credit attributes of any risk position.  We generated the idea of using a bespoke product dimension to model these attributes, discretely identifying the maturity band, priority of claim, business context, form of credit extension, and mitigation offsets associated to each risk position.
  2. Secondary Users: Interview and request documentation from regulatory reporting, financial accounting, and profitability managers outlining their data needs.  Expand the data model and collect data points from feeding systems to meet their requirements.
  3. General Ledger Reconciliation: Create a custom program to aggregate granular positions at a level consistent with the dimensional reporting of the corporate general ledger: department, organization unit, account, and currency.  Use a robust time dimension to ensure that, in the case of revaluation, back valuation, or lagged data, the most current data is used for analysis. Where net positions are relevant, such as with deposits and derivatives, create a process that replicates the netting logic, and reconcile the netted balance to gl.  Check for balance differences between the granular and ledger levels.  Where differences exist, represent them at the granular level such that, when summed, the granular amount equals the ledger amount.  As such, any granular analysis of risk would tie to the bank’s official books and records.  Build associations between the balance differences and the system(s) that provided the granular data.  Identify problem systems and use the reconciliation output as a tool to improve source inputs.
  4. Closely Held Entities: At a granular data level, build a relationship between the dimensions of customer and department.  A customer attribute could identify subsidiaries and affiliates, which could then be associated to the department that originated the position with the closely held entity.  If both parties rolled up to the same legal entity, exclude the position from any analysis.  For those positions with customers that represent subsidiaries or certain affiliates in a different legal entity, flag them for analysis depending on the reporting need.
  5. Mergers and Acquisitions:  Use a generic, surrogate key for all data entities, including dimensions.  If the bank were to merge with another company, the additive data could flow in seamlessly.  For existing data that then transfers to an acquired system, the surrogate assignment process could identify the old data in the new system, preserving its original identifier.
  6. Retail Modeling: Using empirical studies of the portfolio of retail exposures, members of the bank’s portfolio management division identified multiple strata of data to which probability of default (PD) and loss given default (LGD) ratings and usage given default (UGD) percentages could be assigned.  Using a combination of product identifiers (for PD, LGD) and funded status (for UGD), we were able to translate the functional study into a mechanism for rule maintenance.  Each retail position would receive product tags, and periodic analysis of retail data within the data warehouse would provide the means to update the credit ratings and percentages.  A workflow process would allow expert judgment override capability, providing a flexible tool to reflect both evidence and discretion, as well as a decision trail for regulatory review.
  7. Repo-Style Modeling: Design an application that would pool like sets of exposure by business line and associate collateral to each pool, ensuring that securities on either side of the transaction are clearly identified.  Once the pools of exposure and mitigation were defined, they could be sent to an external vendor for simulation of stressed downside price movements in the form of value at risk (VaR).  The VaR calculation could return to the data warehouse for inclusion in an exposure at default (EAD) balance for calculation of regulatory and economic capital downstream.
  8. Credit Exposure Definition: With analysis of exposure occurring at varying levels across systems and business lines, we recommended the creation of a central data mart to consistently define a unit of exposure.  The data mart would build a relationship between the lowest grain of exposure, instrument, and the modeled grain of exposure, exposure set, establishing either a one-to-one or many-to-one relationship.  Perhaps most importantly, the data mart would include logic to ensure every defined exposure, including on and off balance sheet positions, had a PD and LGD rating assigned to it, and would calculate a remaining maturity, derive a rule-based modeled maturity, and calculate EAD.  It would define the universe of exposure types and tag each exposure, creating the first ever enterprise classification for reporting and analysis. The effects of guarantees received would be estimated through a double-default algorithm, and guarantor exposure would be included for economic capital and customer concentration analysis.  For instances where regulatory and economic capital balance requirements diverge, model EAD in both ways as separate balances.  We recommended the inclusion of secondary balances, such as accruals, receivables and assessments, in the definition of a loan equivalent exposure, which would avail them to preferable capital treatment.  In one central place, the bank could define exposure and all its associated attributes and balances, and deliver it consistently to regulatory and economic calculation engines.
  9. Mitigation Definition: EAD and VaR calculations and LGD ratings all rely on mitigation information to derive their values.  We recommended the creation of a consolidated mitigation model, defining the exposure, type and magnitude of mitigation, and the context in which it could be used, such as jurisdiction, governing law and permissions.  The mitigation model would cover collateral, 3rd party guarantees and indemnities, credit derivatives, participations, syndications, and netting.
  10. External Integration: Create a flexible inbound and outbound data transfer platform with firewall security protection.  Define inbound and outbound layers of data within the warehouse: the inbound layer representing the data format of the sending system and the outbound layer representing the data format required by the receiving system, pre-processed into a data mart with analytic cacluations as required.  Both would include validation logic to cleanse data before it entered or left the warehouse.  In this way, the data acquisition paradigm could be blind to the system providing data.  Whether it is an internal legacy system or an external analytic calculation vendor, the treatment is the same: acquire the data in its native format and then validate and transform it into data warehouse dimensional standards.  Finally, build with tools flexible enough to adjust to messaging and a service-oriented architecture when the bank becomes ready for that strategic infrastructure change.
  11. Process Scheduling: A data warehouse normally employs a multitude of technologies to manage data extraction, transfer, load, analytic processing, replication and reporting.  Sequencing of process execution is of high importance, and often crosses technologies. The project team needed to formulate an approach for managing the amalgam of technologies, with the ability to trigger process execution and scale to the level of thousands of daily jobs with varying frequencies, controlled through a central software program.  We recommended investigating, in order of priority: 1) a corporate standard scheduler used in a similar capacity elsewhere at the bank; 2) a best of breed scheduling tool; 3) a custom built interface, using metadata and APIs.  Flexibility to integrate new technologies in the future should be a top priority.
  12. Source System Management: A data warehouse is only as good as the data it receives.  In that vein, it’s vitally important to establish agreements with providing systems as to format, content, timing and frequency of data delivery.  We recommended formalizing this relationship through Service Level Agreements (SLAs), which would document these data expectations and act as a reference point for adherence.  In addition, lines of communication, supported by data reports from the warehouse, would need to be established with source system owners for data quality remediation.  As a best practice, we stressed the importance of identifying data problems in a central warehouse, but managing them in providing systems.  The quality of today’s data is far less important than confidence in the quality of future data; only remedies at the source could ensure that confidence.

Our ideas provided guidance on best practices in data warehousing and functional modeling.  Taken together, they established a foundation on which to build a robust solution.

SOLUTION

Acting in strategic advisory, architecture design and implementation roles, we staffed an eBIS team of 15 financial services professionals, part of a project team of over 75 client and consulting resources. Collaborating with a Big 4 firm to construct the solution, we worked together to translate a package of good ideas into a robust data environment.

The solution embraced all of the ideas outlined: a dimensional data environment addressing the needs of risk, finance, profitability, and regulatory users that ties to the bank’s reported ledger and calculates credit risk measures for Basel and economic reporting. The data warehouse, sized to almost 3 terabytes, orchestrates 1,700+ jobs from close to 50 providing and numerous receiving systems on a daily basis through a dependency-based scheduler.

The solution embodies numerous data warehouse best practices, ones that we documented as project standards, providing an architecture flexible enough to accept new systems and modeling requirements as they emerge. It handles identification and reprocessing of dirty data in a way that preserves the iterative improvements in data through time, while maintaining the locus of responsibility for data quality in originating systems.

Our contribution also included training sessions on the solution architecture for all interested parties within the bank. Our presentations focused on identifying business interpretations of the information captured in the warehouse, so that secondary users, outside of credit portfolio management, in the profitability, regulatory, and finance sectors, could recognize the potential benefits for their areas.

RESULTS

Our initiative was mandated out of a need for a comprehensive credit risk environment to meet regulatory and economic capital reporting requirements. The client committed significant time, monetary and human capital to that end through a project that spanned seven years. The result met the need: a comprehensive financial warehouse from which other reporting tools could extract data for Basel, Federal Reserve, economic credit risk capital and corporate profitability calculations and FFIEC reports.

As Basel III, trading book liquidity, and stress testing requirements unfold, and U.S. regulators set the parameters for adherence to the Dodd-Frank Act, our client has a flexible, scalable data environment in which to adapt. The solution was the first at the bank to consolidate all risk systems and dimensional data in a central warehouse, providing a substantive analytic and reporting tool at a critical time in financial services regulation.

In addition, the solution acts as the important first step on the path to creating a true enterprise data warehouse, from which all bank employees consume analytic data for custom analysis and standardized internal and regulatory reporting. We helped create a data environment that enables the “one source of the truth” that enterprises yearn for. A customer, department, and product are viewed consistently, regardless of the report. A unit of risk has a definition every user can understand. Regulatory, risk, finance, and profitability users can refer to the same intersection of data and get the same result, outcomes that are not easily quantifiable, but unquestionably valuable.

The mandate that set our initiative in motion was clear, but the unintended benefits resulted from a cadre of good ideas and the steadfast belief in designing solutions that can adjust to changing needs.

Instrument Level Profitability

CLIENT

A Top 10 (by assets) US bank

CHALLENGE

Traditional savings and loan banks are in the business of taking deposits to then lend out, earning a spread between the interest paid and received. On the surface, loans are cash cows, generating all of the revenue, while deposits appear as dogs, producing the interest expense necessary to fund the loan book.

Some mechanism is necessary to risk-adjust the spread a bank earns, by product, as administered and managed through a central treasury function. Deposits earn a credit for their worth in funding assets. Loans incur a cost for the expense involved in securing capital to lend. This concept can extend to every position on the balance sheet: every liability has some benefit operationally, while every asset has a cost.

On the income statement, non-interest expenses, associated to servicing, marketing, and administration overhead, exist that don’t easily associate to the products, departments and customers that they support. Organizations must devise a method to allocate these overhead costs back to the areas that generate revenue.

Once the balance sheet and income statement are normalized for profitability, data consumers can analyze any slice of data, down to the lowest grain of instrument (customer account), and understand its fully expense-loaded, risk-adjusted contribution.

With a mandate for improved corporate profitability reporting, our client engaged us to build a comprehensive solution for risk-adjusted profitability. Calculate instrument-level profitability in the commercial loan and deposit books. Transfer price the entire balance sheet. Allocate service overhead costs dimensionally, providing a fully cost-loaded product profitability view. Consolidate all profitability data into a central data store for enterprise consumption. In short, paint a picture of granular, risk-adjusted profitability, accounting for interest rate, liquidity, prepayment and credit risks, as well as costs to market, service, and operate the revenue-generating product lines.

IDEAS

In collaboration with an enterprise software vendor, our ideas centered on four conceptual areas: 1) Transfer price the commercial loan and deposit businesses at the lowest grain of detail to leverage pricing and cash flow information; 2) allocate overhead costs to dimensions not available on the corporate ledger; 3) compile all profitability calculations in a performance ledger; 4) report dimensionalized net interest margin and net profitability contribution.

The details of these ideas are as follows:

1) Instrument Profitability

  • Model the commercial loan and deposit books of business at the instrument level (customer account), leveraging a robust, granular data model to fully describe their pricing and cash flow characteristics and dimensional attributes of product, customer and department.
  • Transfer price the indeterminate term deposit products according to their “core” stable balance levels using the yield of an assumed term, averaged over that same period, e.g., 3 month moving average of the 3 month LIBID.
  • Transfer price the term loans and deposits using a yield curve that splices fed funds, LIBOR/BID, and SWAP rates, with appropriate bid/ask spread adjustments.  Use linear interpolation to bridge observed quotation points, reflecting the convexity of the interest rate environment at the time and the bank’s pricing policies.
  • Based on empirical evidence, assume minimal or no adjustments for prepayment risk.
  • Transfer price the repricing loans according to a repricing schedule, allowing for irregular periodic schedules by instrument.
  • Include a liquidity adjustment cost for the reprice method loans, given that the full term of funding is longer than the reprice term.
  • Use currency-specific yield curves, using the transaction currency to drive pricing, reflecting the liquidity profile of each currency.
  • Choose AA rated swap curves, reflecting the client’s credit costs as a counterparty in swap transactions.


2) Cost Allocation

  • Identify non-interest expense accounts relating to overhead costs.  Use cost drivers to dimensionalize the expense numbers, driving them back to the products and customers that necessitated their expenditure.
  • Use the official general ledger as the input source and the performance ledger as the target, creating a single source of dimensionalized profitability data.


3) Performance Ledger Modeling

  • Import the full balance sheet and income statement ledgers from the source of 10K and 10Q reporting, lagging month-end to allow for adjustments during the GL close process.
  • For those GL dimensions that match the available instrument detail, perform a GL reconciliation.  Plug any difference between the instrument and GL balances such that the GL amount dominates, allowing a profitability perspective that reflects the official books and records.
  • Leverage the instrument detail to aggregate to the ledger level, dimensionalizing the ledger data by product, customer and channel.  Use the rule: instrument detail + reconciliation plugs = ledger amount.
  • For GL positions without instrument detail, assume a term and yield curve for pricing, or a stated basis point charge or credit.
  • Base processing off of a tree that logically depicts groupings of GL accounts in hierarchies, associating transfer pricing rules to clusters with identical functional treatment.
  • Recursively process each account with the lowest level rule associated to it until all accounts are processed, ensuring transfer pricing of the entire balance sheet.
  • Identify inter-company accounts (positions between internal departments) and transfer price them at a 0 rate, effectively eliminating a charge or credit for these balances.
  • Some bank branches have standing agreements with the treasury group to receive pricing based on a pre-arranged spread against a defined index.  For the accounts under these branches, calculate a transfer price cost or credit as a basis point spread against the stated index.
  • Post the transfer pricing output to income statement profitability accounts, representing the cost or worth of funds for each balance sheet position.


4) Reporting

  • With transfer pricing and cost allocations compiled in a central performance ledger, generate dimensionalized profitability reports that detail the components of net contribution for customer-facing products:


             ASSETS                                                                LIABILITIES


   Interest Income                                                    Transfer Pricing Credit

+Fee Income                                                            +Liquidity Credit

-Transfer Pricing Cost                                        +Fee Income

-Liquidity Costs                                                     -Interest Expense

-Overhead Costs                                                  -Overhead Costs

  NET CONTRIBUTION                                        NET CONTRIBUTION


  • Generate net interest margin reports, isolating the raw spread between external interest rate and the cost or worth of funds.
  • Make reports flexible to include the cost of allocated capital, representing external credit, market, and operational risks, to be calculated in a future initiative.

SOLUTION

eBIS led a team consisting of client and partner resources and delivered a robust data capture, processing architecture and reporting framework for profitability analysis. We overcame a number of obstacles during this engagement: a change in business strategy partner, functional gaps in vendor software, and a significant customization to facilitate index spread processing, to name a few. Throughout, our client trusted us to lead the way, leaning on our ability to bridge gaps and deliver the right business solution.

In the end, our profitability solution was the first at this client to consolidate profitability calculations on a single platform, enabling a central definition of business rules and consistent analysis of dimensionalized, risk adjusted profitability.

RESULTS

Is an 18 month CD more profitable than an 18 month unsecured commercial loan? Does it depend on the customers involved? On the surface, counter-intuitive questions, but ones that, if answered effectively, provide great insight into how to manage customers and products, adjust operational incentives, and efficiently allocate future capital.

eBIS delivered a solution to help answer these questions. It’s great tasting pie, one that can help your business not just grow, but grow in the right direction.

Market Floor Risk

CLIENT

The largest deposit institution in Scandinavia

CHALLENGE

Our challenge lay in modeling the economic market risk of contracting spreads on administered rate loan products in low interest rate environments: the effect of deposit interest rates near or at 0%, with loan interest rates steadily declining, compressing net interest margin and profitability. Our client endeavored to allocate market risk economic capital to cover lost profitability, represented by this contracting net interest margin.

It is in these low interest rate environments that demand for capital is often highest, making market risk a key factor in managing aggregate credit extension, product pricing, and fees.

IDEAS

eBIS analyzed the business requirements and internal processes of the client’s market risk group, and recommended a solution model that was parameter-driven, flexible, scalable, and integrated with a larger initiative to build a data warehouse for all capital and profitability reporting.  We categorized various functional requirements, analyzed alternatives, and then submitted our ideas, creating the foundation for a robust technical solution.

We categorized our ideas into 5 areas for ease of reference and management:

1) ARCHITECTURE

  • Translate existing spreadsheet analysis to a scalable relational database environment with a flexible development platform, enabling user-defined input parameters on the front-end and the ability to reactively change modeling architecture on the back end.
  • Minimize data redundancy and maintenance by centralizing configuration, input and output data in a central data warehouse, common to all economic capital engines.  Benefits:

a) A common data model
b) Consistent processing architecture
c) Reliable data inputs, which are validated and cleansed prior to processing
d) Modeled dimensions that provide depth and meaning to fact data
e) Scenario capabilities, allowing comparison of varying business assumptions

 2) STOCHASTIC INTEREST RATE SIMULATION

  • Using prevailing interest rate levels as a starting point, stochastically simulate interest paths through time using the Cox, Ingersoll, Ross monte carlo method.  Calibrate a trend line relative to the interest rate starting point.
  • Simulate interest rates to a user-defined horizon, e.g., 10 years, with income losses discounted on an NPV basis back to the end of year 1 using a user-defined discount factor, or one inferred from the stochastic equation.
  • Set the number of interest path iterations based on user input.  Enable scalability of simulation paths to the hundreds of thousands.
  • Set stochastic generation for capital allocation to 50,000 paths, a level that allows modeling at a high downside confidence interval, 99.97%, representative of a desired S&P credit rating of AA.
  • Provide a random seed input to control reproduction of simulations across models and within variables, e.g., currency.
  • Allow definition of a simulation index separate from product pricing indicies.  A delta in the simulation index would apply to the forecast periods of a product pricing index.
  • Truncate simulated price movements at 0, but track internally the cumulative price level when negative.  In instances where the simulation index has a starting point higher than the product pricing index, the deltas could trend to positive territory later in the simulation.
  • Make the simulation index currency specific, associated to either the transaction or base currency.

3) RELATIVE INTEREST RATES & VOLATILITY

  • Tie the magnitude of volatility to relative interest rates; high interest rate environments will produce larger simulated interest rate movements than low ones.  Use a volatility algorithm that prevents simulated interest rates from dropping below 0.
  • In stochastic modeling, force the interest rate path back to an assumed long-term rate based on two user-defined variables: a) mean reversion speed and b) term of volatility.
  • Provide the ability to model an expected path of interest rates, modeled without the volatility component, for expected loss calculations.
  • Start the simulation at any point (maturity) on a user-specified historical yield curve, allowing for currency-specific simulations.
  • Assume parallel shifts in the asset and liability rates.  If empirical evidence suggests interest rates shift non-congruently by product, provide the ability to adjust the indices representing the asset and liability sides of the spread equation discretely.
  • Calibrate model parameters to account for lower volatility at low interest rate levels, yet theoretically greater risk of loss events (contracting margin), and hence higher economic capital.

4) CAPITAL CALCULATION

  • Employ VaR as the analytic measure, with downside loss levels measured as the difference in net interest margins through time, translating directly to allocated capital levels through a loss function.
  • Make the loss function calculation dependent on the simulation index interest rate starting point and its position relative to the assumed long-term interest rate.  If the starting rate is < the long term rate, the unexpected loss is the path of rate simulation below the starting rate.  If the starting rate > the long term rate, the unexpected loss is the spreads between the expected long term rates and unexpected rates.
  • Focus the loss function on simulated interest income and expense cash flows, which are not easily hedged centrally through transfer pricing.  Exclude from analysis fee or non-interest income that may be administered as a reaction to interest rate levels.
  • Make capital allocation a function of the loss distribution, specifically the loss at the desired confidence interval in a tailed test, given the user-specified number of iterations.  In a simulation of 50,000 interest rate paths in a one-tailed test, capital is allocated against the 15th largest portfolio income loss.
  • Adjust portfolio loss for VaR correlation and diversification factors to arrive at a final capital number.

5) DIMENSIONAL MODELING

  • Use product groups to pool positions with similar attributes for processing and analysis.  Use a weighted average formula for calculation of variables that differ within product group.
  • Allow for scenario-based simulation parameters to override standard product attributes.  For instance, if an administrative rate product pricing schedule calls for repricing upon a change in the fed funds rate, during simulation change the reprice trigger to any change in the stochastic rate path.
  • Multi-dimensionalize the lost margin spread according to the input grain: currency, product group and department.

SOLUTION

We delivered a detailed architectural model for estimation of extreme downside interest rate market risk, calibrated to allocate capital relative to expected interest rates, and integrated with an enterprise risk management software suite.

Through tight collaboration with client stakeholders and an enterprise software vendor, we generated value-added ideas, and then applied them to an application roadmap. It was through our bridge-building process that our client received critical business solution architecture on an enterprise risk management platform where none previously existed.

A win for our client through improved functional modeling, solution flexibility, and data integration. A potential new product offering for an enterprise vendor partner. And eBIS helping in between doing what we do best: facilitating solutions for our clients.

RESULTS

In times of activist monetary policies, instituted by central banks to increase economic activity, commercial and retail banks feel pressure to increase capital supply. In these environments, interest rate market risk assumes heightened significance. Deposit interest rates can approach zero. Customers clamor to secure capital. Net interest margin compression can materially affect bank profitability. Case in point: JP Morgan Chase saw its net interest margin fall 31 basis points from March 31 to September 30, 2010, decreasing its net interest income by $1.2 billion. Financial institutions need a tool to assess the risk of market variables derailing their revenue model, influencing tangential areas such as product pricing, fees and credit extension.

eBIS provided this mechanism, enabling our client to understand the potential effect of market interest rate variables on product profitability. The result? Much more informed loan book management.

Achieving Basel II Compliance

CLIENT

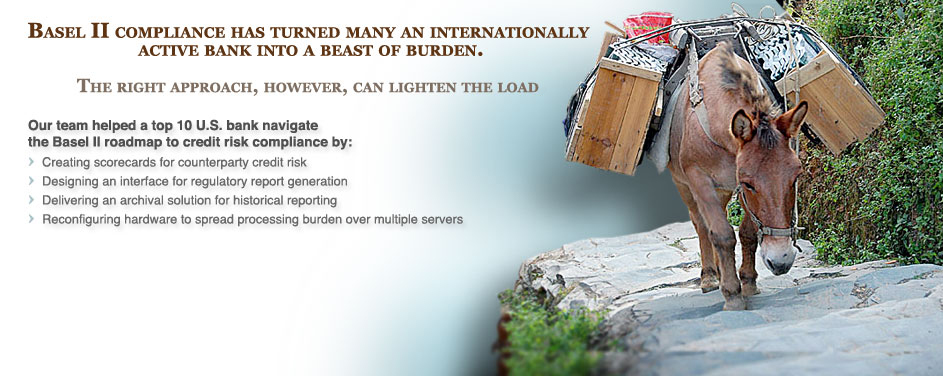
A Top 10 (by assets) internationally active US bank required to comply with the Basel II capital regime

CHALLENGE

In July of 2003, the Federal Reserve, the Office of the Comptroller of the Currency (OCC), the Federal Deposit Insurance Corporation (FDIC), and the Office of Thrift Supervision (OTS) jointly issued an Advanced Notice of Proposed Rulemaking (ANPR), a primer for U.S. implementation of the Basel II capital accord.  The accord was originated by the Basel Committee on Banking Supervision (BCBS) and intended to harmonize best practices in risk-sensitive economic capital measurement with regulatory capital adequacy requirements.  The ANPR outlined updated modeling options for both credit and operational risk, defining functionally advanced capital calculations.  Within credit risk, the most advanced model, known as the Advanced Internal Ratings Based (A-IRB) approach, based capital on credit ratings crafted internally, evolving from the standardized ledger-based rules of Basel I, released in 1988, to a granular computation model, either at the customer account level or some aggregation thereof.   The top 10 banks, with over $250 billion in total assets and internationally active asset portfolios of at least $10 billion, were notified of the expectation of compliance with A-IRB.  Thus, their internal credit operations and data management capabilities would need upgrades where necessary to meet the requirements of compliance.

Notice of Proposed Rulemaking (NPR) succeeded ANPR in July of 2006, followed by final rulemaking in November of 2007.  Implementation timelines were delayed as U.S. legislators weighed effects of lowered capital levels and competitive disadvantages to community banks lacking the infrastructure to support an advanced implementation, as well as wrangling over capital floors and transition periods in capital minimums from Basel I to Basel II.  Final rulemaking called for parallel calculation of Basel I and II capital for a one year period, commencing sometime between 2nd quarter 2008 through a ceiling of 1st quarter 2010, with transitionary capital floors in place through three oversight periods following the end of parallel run.

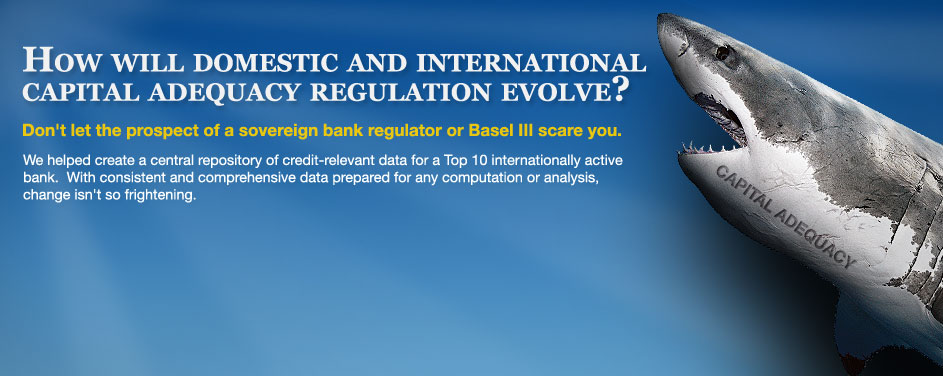
And, that’s just U.S. rulemaking.  For banks doing business outside of the U.S., they were under the same scrutiny to comply with interpretations of Basel II by foreign regulators, such as the Financial Services Authority (FSA) in the U.K. and the Australian Prudential Regulation Authority (APRA) in Australia.  Thus, a bank with global reach would need to implement Basel II calculation and reporting solutions for each of the jurisdictions in which it operates, with each potentially on a different compliance timeline.

After years of uncertainty, the challenge facing the top 10 banks in the U.S. was finally crystallized by end 2007, as both foreign and domestic regulators had issued final interpretations of the latest Basel accord.  As one of the top 10, our client was on center stage.  Supported by a credit risk data warehouse platform for data management, their challenge lay in:

  1. Reviewing the calculation options within A-IRB by book of business and choosing approaches for U.S. compliance;
  2. Identifying the asset exposures originated in foreign jurisdictions and implementing an accepted calculation and reporting solution for those sub-portfolios;
  3. Conducting a fit/gap of their existing credit architecture against the chosen regulatory models, identifying data and design gaps, determining remediation steps, and implementing solutions;
  4. Upgrading their internal operations to support Basel identification, calculation, and model validation procedures.

Our client engaged the eBIS team to tackle challenges 2 & 3.  Collaborating with a Big 4 partner responsible for items 1 & 4, we endeavored to comprehensively review Basel rulemaking and deliver solutions for jurisdictional compliance.  And, we accepted perhaps one other challenge: prove the law of inertia, keeping a large initiative moving steadily forward with a push of positive momentum, overcoming the weight of modeling complexity and years of rulemaking uncertainty.

IDEAS

With a need for regulatory credit capital compliance both domestically and in foreign jurisdictions on divergent timelines, we saw an opportunity to approach the initiative in three distinct but complimentary parts: 1) domestic compliance, 2) foreign compliance and 3) infrastructure and solution maintenance upgrades. We set out to generate ideas in each area, which, taken together, could amount to a cohesive regulatory compliance plan.

 Domestic Compliance

In 2008, there remained significant analysis to complete for domestic Basel compliance, and not much opening left in the window for parallel run. By the second quarter, some U.S. banks had already begun their one-year parallel run, while our client was in the throes of contemplating the cost/benefit of various A-IRB calculation methods by asset type. With limited time, we recognized the need to leverage the client’s existing architecture as much as possible. We recommended completing a comprehensive fit/gap against their credit risk data warehouse, a platform for both regulatory and economic capital management, once the calculation methods were chosen. With concurrence from the client, our eBIS team compiled the fit/gap analysis, identifying over 70 distinct data and modeling gaps against the selected A-IRB methods and the FFEIC reports required for Basel compliance. Along with identification of gaps, we also provided recommendations for remediation. A sampling of our ideas in key functional categories:

  1. Counterparty Scorecards for Probability of Default (PD) estimation: In a desire to migrate to a more quantitative factors-based rating model for wholesale counterparties, the client chose a scorecard solution from a ratings agency.  The tool would allow through-the-cycle empirical data for stressed (economic downturn) parameter estimation.  With a decisively stated rating philosophy as a Basel II requirement, we suggested management of the project with a resource familiar with the legacy credit system, one that relies on expert judgment to a greater degree.  For, although the scorecard process would be decidedly empirical, expert judgment would still be necessary for counterparties that lack sufficient credit history or proxies.
  2. Historical reporting, model validation and Quantitative Impact Studies (QIS): Banks may estimate risk parameters, but what can determine their accuracy?  Validating history against a once forward looking estimation is the Basel requirement.  We recommended the creation of an history environment (see infrastructure section) to store all historical data for just this purpose.  It would include loss recovery data (LGD validation), facility drawdown patterns (EAD validation), and historical counterparty defaults, under the Basel definition, for PD validation.  In addition, Basel II rules include stipulations requiring visibility to the lineage of a customer relationship and its exposures, called “cradle to grave.”  The archive solution would also facilitate such an analysis, showing the point at which the relationship began with the first approval of credit and all subsequent draws and changes in the level of credit extended.  For QIS on demand, as is often requested by regulatory authorities during the rulemaking process, the archive would act as a sandbox for culling the specific historical data necessary for analysis.  A custom interface could supply altered calculation parameters for investigation of how a new regulatory method would affect any subset of data.
  3. Pillar III reporting: Create a datamart to model capital calculations for public disclosure under Pillar III.  Include the attributes necessary to model capital amounts and structure by legal entity or depository institution, with logic to analyze corporate structure and exclude or haircut subsidiaries not mandated for reporting.  Design such that required capital levels, e.g., Tier 1 and 2 and total eligible, could be easily reported by dimension, e.g., asset category or RWA calculation, along with other metrics, such leverage ratios, including the compilation of non-risk weighted asset denominators where required.
  4. 3rd Party Guarantee modeling: We conducted an analysis of approved modeling options, comparing them to the data architecture available through their warehouse.  We recommended the PD substitution approach, which, although differing from LGD adjustment in their economic model, would provide the path of least resistance for implementation.  For, under the LGD adjustment method, the Basel accord calls for a comparison of capital required with LGD adjustment to that required with PD substitution, with LGD adjustment permitted only when it is punitive on a relative basis.  Thus, LGD adjustment would require the PD substitution calculation, yet provide no capital benefit.  To further ease implementation costs, we recommended disregarding partial guarantees and those with a maturity or currency mismatch.
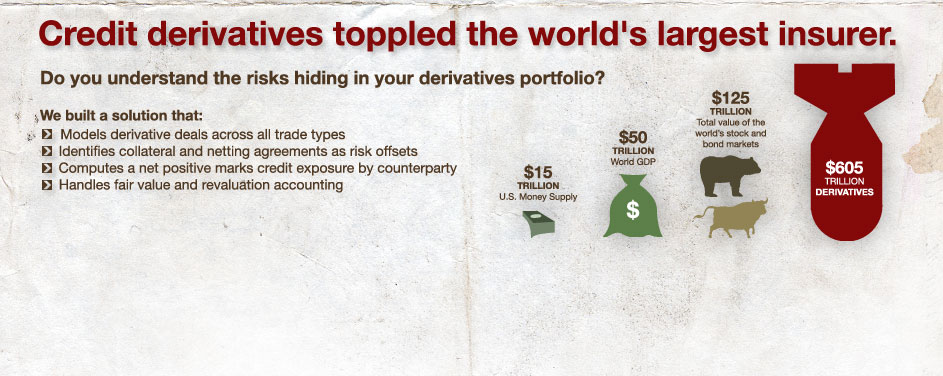
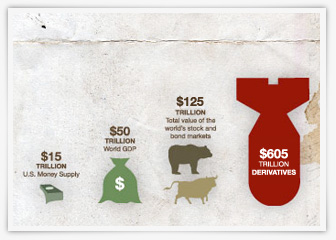
  5. Credit Derivatives modeling: Credit derivatives posed a number of challenges.  Purchased credit derivatives could qualify as synthetic securitizations and would need to be analyzed and identified.  They also were not accounted for as a mitigant in ratings assignment.  In regulatory calculations under the Current Exposure Method (CEM), counterparty credit risk is ignored under certain conditions, but reference asset risk is not, with capital required for sold credit derivatives.  Finally, rules allow for a cap on potential future exposure (PFE) for these positions up to the amount of the unpaid premium.  We recommended that they: a) establish internal process to analyze credit derivatives and tag their underlying assets as synthetic securitizations, which could feed into securitizations capital processing; b) update the LGD assignment process to include the effect of credit derivatives purchased as a guarantee; c) establish a process to analyze the 8 criteria for exclusion of counterparty risk on hedges, and tag the credit derivative exposures for such exclusion; d) for sold positions, establish a mapping from the credit rating of the reference asset to a defined PD risk rating, and model that mapped PD on the exposure; e) exlude the PFE benefit of the premium cap for the sake of implementation simplicity, which is allowed under the Basel concept of conservatism.
  6. Securitizations modeling: As with credit derivatives, the devil in securitizations compliance lies in the details.  Of note, asset backed commercial paper (ABCP) support facilities would need to meet 4 criteria for preferable IAA treatment; quantification of exposure to purchased securitizations depends on accounting treatment (AFS vs. HTM); related securitizations can act as proxies for those that lack NRSRO ratings; the number of securities and seniority of purchased tranche affects capital computation.  We recommended: a) an updated process for division portfolio managers to analyze ABCP support facilities and identify them as IAA eligible based on: the quality of the collateral pledged to the SIV, its investment guidelines, and an equivalent NRSRO rating for the SIV; b) using GL accounts to determine accounting treatment and unwinding unrealized gains and losses for purchased securitizations; c) improve securitizations workflow to analyze  and identify candidates for proxy (subordination, no credit enhancements, equal or lesser duration); d) use a NRSRO to quantify positions in a securitization and a combination of asset class, payment factor, remaining maturity and credit rating to determine quality of the tranche purchased.
  7. Repo Style transaction modeling: For the largest portfolios, the bank chose a VaR approach, which was already in place and producing accurate results.  For smaller portfolios, which had no validated VaR processing, an adjusted LGD approach was chosen.  To facilitate accurate LGD assignment for these portfolios, in recognition of their over-collateralization and daily re-margining rules, we recommended two approaches: a) for those credits governed by facilities, enhance the LGD assignment process, managed by division portfolio managers, to consider the collateral rolling up to each facility; b) for those exposures with no credit facility, define the business practice for collateralization by exposure type and assign a default LGD rating representative of that collateral level.  The default rating could be validated empirically and back tested through time against actual collateral levels and realized loss data.

 Foreign Compliance

Foreign compliance centered on the FSA in the U.K., which permitted standardized computation methods, much akin to what was already in place for Basel I. To simplify modeling and lower implementation costs, the client chose this method.  However, while the calculation methods were not new, the FSA reporting was mandated daily. Capital reports would need to be generated every business day by a stated “drop dead” time, within a required confidence interval.

Our idea was to tie this requirement to three infrastructure items: Service Level Agreement (SLA) adherence from providing systems, batch management, and external system integration. SLA adherence would monitor the timing, comprehensiveness, and quality of the U.K. data necessary for report generation, and manage exception causes with the source providers. Batch management would prioritize the technical jobs containing U.K. data so that they processed as soon as their dependencies were met, ahead of other competing jobs if necessary. External system integration would provide a mechanism to publish the data comprehensive of FSA report generation for consumption by the regulatory software vendor (see infrastructure section).

 Infrastructure

The bank’s data warehouse platform was originally designed for a small scale profitability project, which expanded over time to reach quasi-enterprise warehouse scale.  However, upgrades to the underlying infrastructure had not kept pace with functional demands.  Terabytes of data were accumulating on a single production database, serviced by an outdated server.  In addition, the environment served many masters from various functional areas, yet there was no tool to analyze the effect of a change in a technical object or piece of metadata on the array of applications that might use it.  To address these back-end and operational constraints, we introduced a number of ideas:

  1. Infrastructure Upgrades: The production environment was behaving like a newborn baby.  It demanded a lot of attention, but might still cry even after consoling.  It was obvious to us that the infrastructure needed a thorough review, from servers to applications.  We recommended performance studies on each tier of technology: a) hardware server architecture; b) operating system and network capacity; c) database configuration; d) application tuning.  In addition, we recommended the creation of a test environment, mirroring the data load and configuration of the production environment, which would provide visibility to the effect of incremental application development.  If new processing degrades performance, administrators could make proactive infrastructure changes before applications reach production.
  2. Historical Data Capture and Archiving: We suggested creating a separate environment for unlimited historical data capture, delineated temporally by data anticipated for reporting and older data that could be archived and analyzed by request.  This environment for historical data capture and reporting would address a number of project requirements.  First and foremost, it would provide the data needed for QIS on demand and credit parameter validation studies, both regulatory requirements.  Secondly, such an environment would provide the fertile ground upon which robust reporting solutions could be built to feed internal analysis of credit risk, financial positions, and risk adjusted profitability.  Finally, the environment would allow a migration and purge of historical data that was choking performance in the production database.  A replication tool at the database level could port data across environments, making new data available in the history environment in near real time.
  3. Outbound System Integration: Providing data to other systems, particularly the Basel II regulatory reporting interface, presented some challenges.  The data warehouse data model was not easily interpreted, with complex time dimensions and surrogate keys.  In order to provide a comprehensive set of data from the most recent data load for a specific reporting date, it would prove useful to embed logic in a routine that executes within the warehouse and preps the data for consuming systems.  Also, with system performance an issue, particularly select contention causing table locks, it was technically advantageous to publish data to tables configured specifically for outbound extraction.  We recommended a publication solution to address these issues.
  4. Metadata Management: A data warehouse requires a patchwork of technologies to acquire, process, calculate, replicate, publish and report data.  Normally each technology has its own metadata, or information about objects or data, to manage its domain of processing.  However, no solution was in place in this environment to manage metadata across technologies, enabling users to analyze the universe of application technologies in a common format.  We recommended the development of a metadata management solution for this purpose.  Common metadata could also assist with change management, producing reports on the interconnectedness of objects and enabling users to understand how changes in one area affect downstream processing in separate, but related technologies.

SOLUTION

Many of the ideas that we presented were adopted, and we were instrumental in realizing them as solutions.

To stabilize their technical architecture, we managed improvements to their hardware, network, database, and applications. Of particular note, our analysis, advice and recommendations led to the acquisition of several new servers, reducing the processing strain in production and dedicating processing resources according to need: development, production, and historical reporting. We provided design oversight for the delivery of a metadata management tool, integrating information from multiple technologies for centralized analysis of linkages between technical objects. We designed and delivered a publication tool to lessen technical contention and present the right data for downstream Basel II capital calculations, report generation and consumption.

For foreign compliance, we implemented a data monitoring framework focused on SLA adherence, improving the timeliness of delivery by clearly defining data requirements and the locus of responsibility for data delivery. We also engineered a mechanism to prioritize the order of process execution and define dependencies for optimal efficiency.

For domestic rules adherence, we managed the implementation of the counterparty scorecard project, delivering a Basel-compliant wholesale customer scoring tool that was more in line with an industry best practice of modeling with quantitative factors. We designed, developed and managed the solution for historical reporting, credit parameter model validation and QIS, delivering a terabyte-scale data replication platform for near real-time data access. As experts on their data architecture and credit modeling, we provided advisory services on strategies for effective implementation of their favored A-IRB calculation methods.

In addition, we compiled and delivered functional training sessions, by asset category, on the chosen A-IRB modeling techniques under Basel II. The training sessions provided a financial interpretation of each group of exposures, a description of where related data originates and resides in the warehouse, the benefits of the chosen calculation model, the calculations performed, and the expected capital results, with every training participant receiving a training manual for ongoing reference. We also provided market commentary on why credit risk was relevant for each category of exposure, often submitting anecdotes relating the client’s portfolio to events that transpired during the global credit crisis.

RESULTS

Heading into 2008, our client faced high hurdles: standardized foreign compliance reporting, an effort to decipher and implement the final Basel II rules in the U.S. in a compressed time-frame, and stabilization of a temperamental technical platform supporting both initiatives.

Our solutions helped surmount all of these hurdles, contributing to efficient daily reporting to the FSA, a robust credit modeling architecture for domestic compliance, and a reliable platform on which to operate both. As a result, our client met its foreign reporting deadlines, and began its domestic Basel II parallel run by the required ceiling date of 1st quarter 2010.

After over 6 years of effort, the client had met all of its initial Basel reporting requirements. eBIS was there throughout, generating ideas and engineering solutions to help reach their Basel II compliance goals. The beast moved slowly and the load was heavy, but it walked consistently in the right direction with a concerted effort by both our client and its consulting partners.

Reengineering a Strategic Initiative

CLIENT

A top 5 (by revenue) global Corporate and Investment Bank

CHALLENGE

Large financial services corporations often balance hundreds of complex projects, with considerable resource commitment and capital cost. For the most complex initiatives, a multitude of variables can collude to derail success: arcane requirements, varied resources with divergent skill sets, stakeholders with conflicting objectives, and dependencies that cross internal areas. How can firms effectively manage these factors, and do so consistently across projects?

Our client engaged us to help find an answer. Midway through one of its most high profile and costly initiatives to build a corporate data warehouse, we were to perform a project review, addressing specific tactical problems, as well as strategies to restructure and administer projects more effectively. With the laws of inertia keeping bad practices in motion and momentum building toward eminent delivery schedules, we endeavored to provide a fresh perspective, reframing the project with an eye toward standards, process, and discipline. Nouns that translate well to any initiative.

IDEAS

We approached the engagement with two objectives in mind: 1) document best practices and 2) provide tactical examples of how to apply the best practice concepts to their current challenges.

What leaped out at us was a need for structure.  Business requirements were misinterpreted without functional input, project teams were compiled inconsistently as a reaction to business demands, and technologies were developed without coordination, often overwhelming the underlying technical infrastructure.

Our ideas would need to keep structure at the forefront.

We recommended 4 actions:

1) Mandate Structure

  • Define how project teams should be constructed: according to technology and functional goal.
  • Define staffing of project teams according to Solution Delivery Life Cycle (SDLC) phase.
  • Define roles and their responsibilities and required skill sets.  Resources are not allocated to a role unless their skill sets match the role.
  • Structure a Program Management Office to include project sponsors, vendor representatives, project managers, and oversight committee chairs.
  • Create oversight committees, compiled with subject matter experts (SMEs), to guide project teams and define standards.
  • Structure oversight committees to cover SDLC phases and infrastructure areas, led by a committee chair, as follows:
    Committee Name Area Responsibilities


    Business Requirements


    SDLC: Define

    1)BRD and FRS standards and business process definitions

    2)Approval of related project documentation


    Data Model & Data Integration


    SDLC: Design

    1)Data model standards

    2)Approval of object creation


    Technical Process Design


    SDLC: Design

    1)Design document standards

    2)Approval of related project documentation


    Testing & Migration


    SDLC: Test & Deploy

    1)Test Plan standards, including approach for test issue triage

    2)Migration standards

    3)Approval of test plan documents and migration requests


    Operations & Support


    SDLC: Support

    1)Transition Plan standards

    2)Training standards

    3)Approval of related documentation


    Technical Infrastructure


    Infrastructure

    1)Hardware assessments:

    CPU, Memory, I/O capacity

    2)DB Software assessments:

    Partitioning, Table Spacing, Page File Sizing, Transaction Log Sizing

    3)Application Tuning assessments

    4)Vendor selection and management


    Batch Scheduling


    Infrastructure

    1)SLA management on data inputs and outputs

    2)Dependency and metadata standards

    3)Software Integration management


    Data Gaps & Source  System Remediation


    Infrastructure

    1)Data quality management

    2)Remediation strategies with source systems

2) Document Standards

Standards are critical in every aspect of a project.  Without them, one cannot validate if something was done the right way or determine a remediation strategy.  It was clear that our client could benefit from clearly defined standards, and we recommended oversight committees as the vehicle to realize them.  Staff them with people well versed in a discipline, and let them document their wisdom for the benefit of others.

Thus, the guiding purpose of oversight committees and the standards they create: define the best way to do something, and ensure that it is done that way every time.

3) Define Processes & Procedures

With the recommended structure of projects clearly defined, we outlined communication matrices:  how resources within certain roles should interact.  Of particular importance for this project was the relationship between project teams and oversight committees.  It was clear that, for the sake of design consistency and standards adherence, project leads would need to report to, and gain approval from, oversight committee chairs as a criteria for progressing through SDLC and implementing any technology.  A process for defining standards, training users on those standards and offering an avenue to improve the standards would ensure that all project resources would have the information they need to implement successfully.

If oversight committees determine gaps against defined standards, define a procedure to reconcile the differences: document gaps, suggest a fix or new technology, and initiate a new feedback loop for the amendment.  Define repeatable procedures where lacking, in areas like technology migrations and project issue management.

4) Institute Governance & Control

Leverage the PMO concept to control the execution of best practices.  Its recommended revised structure includes representatives across all effected groups: oversight committees, project teams, vendors, and sponsors.  Collaboratively monitor and govern the rollout of this new operational model.

In parallel, administer the common responsibilities of a PMO: budget, secure funding, track progress, control project scope and risk.

SOLUTION

Our solution objective was to apply our ideas tactically to stated client needs, illuminating where our concepts meet their practice.

For our prototype, we addressed a business problem in foreign jurisdiction reporting.  Some sovereigns require accounting that differs from GAAP, mandate bespoke customer reporting, and specify unique criteria for customer actions, such as default.  Poland, in particular, diverges from other EMEA nations in these areas.  Sub-systems were configured to handle these peculiarities, but how could a conformed data warehouse, with its standardization, integrate them?

We felt it a great opportunity to demonstrate how processes focused on implementation standards could handle unforeseen curveballs.  With oversight committees established to guide implementation teams, it was a question of flowing the new requirements to the appropriate committees.  Let the committee members interpret, and then add to or amend existing standards to accommodate the oddities.  Voila.  The implementation teams then have the information to execute, not just for this requirement, but for anything similar that might arise in the future.

Specifically for foreign reporting, we documented the types of standards for which each oversight committee was responsible.  Then, we applied 5 sample business requirement gaps to the committee(s) that would need to incorporate them:

Foreign Reporting Business Requirement Gaps Oversight Committee(s)
1) System input for calculation of unused commitment amount Data Model & Data Integration
2) Local system input for collateral pledged at transaction level Data Model & Data Integration
3) Revised EAD calculation for collateral offset at transaction level Technical Process Design
4) Revised definition of Basel counterparty default and customer classification of Corporate vs. Government Data Model & Data Integration
5) Batch scheduling adjustments to meet reporting Service Level Agreement (SLA) Batch Scheduling; Data Gaps & Source System Remediation

From there, it was an exercise of staffing project teams to use the standards for the new requirements, embracing the review and approval procedures between project teams and oversight committees, and monitoring timelines and project risk.  All of these were processes under the guise of our reengineered operating model: a complete solution for running projects more effectively.

RESULTS

Enterprise projects are complicated. And it’s a complex task to make them simple.

While perhaps not simplification, structure at least provides the means to consistently coordinate efforts, defining who, what, when and how. Our reengineering solution did just that: it defined the parameters under which standards are conceived, implemented and monitored. These perspectives provided a sustainable model for project management and solution delivery of large scale projects. Projects that, if they become unwieldy, can produce outcomes worse than cost overruns: solutions that lack utility.

Our client took our ideas and applied them, over time, to their initiatives. The result? Portable, reusable processes. Better management tools. Outcomes with higher quality.